ComponentOne FlexChart for WinForms
Step 2: Binding FlexChart to a Data Source
FlexChart > Quick Start > Step 2: Binding FlexChart to a Data Source

After you have added the FlexChart control to the form, you need to bind it to a valid data source. 

The below-mentioned code illustrates how to bind FlexChart to a data source to plot the required data.

To run the given code successfully, you need to insert the System.Data.OleDb namespace in the code behind.

Add the following code in the Form_Load event:

' retrieve data from the data source
Dim conPath As String = "Provider=Microsoft.Jet.OLEDB.4.0;" & vbCr & vbLf &
                        "Data Source=C:\\Users\\GPCTAdmin\\Desktop\\C1NWind.mdb"
Dim conQuery As String = "SELECT * FROM Cars WHERE Brand = 'BMW'"
Dim da As New OleDbDataAdapter(conQuery, conPath)

' fill the data table
da.Fill(dt)

' bind FlexChart to the data table
FlexChart1.DataSource = dt

' clear data series collection
FlexChart1.Series.Clear()

' create data series
Dim series1 As New C1.Win.Chart.Series()
Dim series2 As New C1.Win.Chart.Series()
Dim series3 As New C1.Win.Chart.Series()

' add the series to the series collection
FlexChart1.Series.Add(series1)
FlexChart1.Series.Add(series2)
FlexChart1.Series.Add(series3)

' name the series
series1.Name = "Liter"
series2.Name = "Cyl"
series3.Name = "MPG_City"

' bind X-axis and Y-axis 
FlexChart1.BindingX = "Model"
series1.Binding = "Liter"
series2.Binding = "Cyl"
series3.Binding = "MPG_City"

' set the chart type
FlexChart1.ChartType = C1.Chart.ChartType.Column

' set the legend position
FlexChart1.Legend.Position = C1.Chart.Position.Right
DataTable dt = new DataTable();
            
// retrieve data from the data source
string conPath = @"Provider=Microsoft.Jet.OLEDB.4.0;
                Data Source=C:\\Users\\<User Name>\\Desktop\\C1NWind.mdb"; // Provide the local path of data source
string conQuery = "SELECT * FROM Cars WHERE Brand = 'BMW'";
OleDbDataAdapter da = new OleDbDataAdapter(conQuery, conPath);

// fill the data table
da.Fill(dt);

// bind FlexChart to the data table
flexChart1.DataSource = dt;

// clear data series collection
flexChart1.Series.Clear();

// create data series
C1.Win.Chart.Series series1 = new C1.Win.Chart.Series();
C1.Win.Chart.Series series2 = new C1.Win.Chart.Series();
C1.Win.Chart.Series series3 = new C1.Win.Chart.Series();
           

// add the series to the series collection
flexChart1.Series.Add(series1);
flexChart1.Series.Add(series2);
flexChart1.Series.Add(series3);
           

// name the series
series1.Name = "Liter";
series2.Name = "Cyl";
series3.Name = "MPG_City";
           

// bind X-axis and Y-axis 
flexChart1.BindingX = "Model";
series1.Binding = "Liter";
series2.Binding = "Cyl";
series3.Binding = "MPG_City";
           

// set the chart type
flexChart1.ChartType = C1.Chart.ChartType.Column;

// set the legend position
flexChart1.Legend.Position = C1.Chart.Position.Right;

Once you've added the code in the Form_Load event, run the application and observe the output.

Notice that the output appears with the plotted data, as shown below:

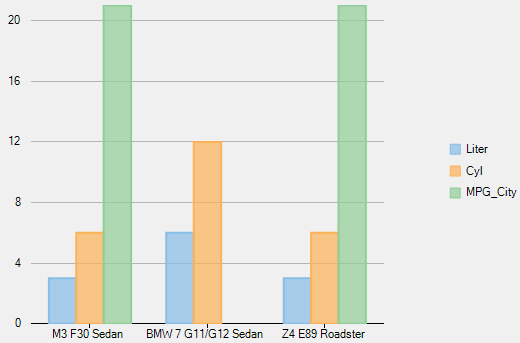
You have successfully created a simple FlexChart application.

This concludes the quick start.