ComponentOne FlexChart for WinForms
Bar
FlexChart > Understanding FlexChart > FlexChart Types > Bar

The Bar Chart compares values across various categories or displays variations in a data series over time. The chart displays horizontal bars for data series plotted against X-axis and arranges categories or items on Y-axis.

To create the Bar Chart at design-time, you need to set the ChartType property to Bar in the Properties window. And to create the same at run-time, you need to set the property in code behind.

To create the stacking Bar Chart, you need to set the Stacking property either to Stacked or Stacked100pc.

Consider that a retailer wants to order six different types of products in beverages for his store. The order is to be placed with a distributor who provides the retailer with the requisite information regarding the products. The information comprises the price of each unit of a product, the number of units available in stock, and the number of units available on order.

Here are the criteria that the retailer follows to order the products: unit price < $25, units in stock > 20, and units available on order > 20.

Let's prepare a comparison chart to help the retailer decide the products he can order. Since the number of products to be compared is six, the Bar Chart is apt for this case.

Sample Data Table

Beverages Unit Price ($) Units In Stock Units On Order
Tea 18 39 40
Coffee 19 17 70
Cocktail 10 13 30
Mock Tail 22 53 20
Soft Drink 21 120 70
Mineral Water 25 90 40

Bar Chart

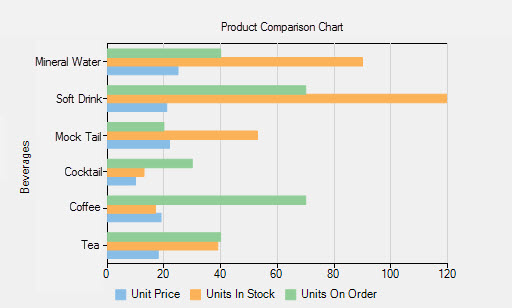
The above chart compares six different products on the basis of their unit price, units available in stock, and units available on order. The bars for the three series have been rendered using different colors.

See the following code to implement the scenario:

' create a datatable
Dim dt As New DataTable("Product Comparison")

' add columns to the datatable
dt.Columns.Add("Beverages", GetType(String))
dt.Columns.Add("Unit Price", GetType(Integer))
dt.Columns.Add("Units In Stock", GetType(Integer))
dt.Columns.Add("Units On Order", GetType(Integer))

' add rows to the datatable
dt.Rows.Add("Tea", 18, 39, 40)
dt.Rows.Add("Coffee", 19, 17, 70)
dt.Rows.Add("Cocktail", 10, 13, 30)
dt.Rows.Add("Mock Tail", 22, 53, 20)
dt.Rows.Add("Soft Drink", 21, 120, 70)
dt.Rows.Add("Mineral Water", 25, 90, 40)

' clear data series collection
FlexChart1.Series.Clear()

' create data series
Dim series1 As New C1.Win.Chart.Series()
Dim series2 As New C1.Win.Chart.Series()
Dim series3 As New C1.Win.Chart.Series()

' add the data series to the data series collection
FlexChart1.Series.Add(series1)
FlexChart1.Series.Add(series2)
FlexChart1.Series.Add(series3)

' specify the datasource for the chart
FlexChart1.DataSource = dt

' bind the X-axis
FlexChart1.BindingX = "Beverages"

' bind the Y axes
series1.Binding = "Unit Price"
series2.Binding = "Units In Stock"
series3.Binding = "Units On Order"

' name the series
series1.Name = "Unit Price"
series2.Name = "Units In Stock"
series3.Name = "Units On Order"

' set the chart type to bar
FlexChart1.ChartType = C1.Chart.ChartType.Bar
// create a datatable
DataTable dt = new DataTable("Product Comparison");

// add columns to the datatable
dt.Columns.Add("Beverages", typeof(string));
dt.Columns.Add("Unit Price", typeof(int));
dt.Columns.Add("Units In Stock", typeof(int));
dt.Columns.Add("Units On Order", typeof(int));

// add rows to the datatable
dt.Rows.Add("Tea", 18, 39, 40);
dt.Rows.Add("Coffee", 19, 17, 70); 
dt.Rows.Add("Cocktail", 10, 13, 30); 
dt.Rows.Add("Mock Tail", 22, 53, 20); 
dt.Rows.Add("Soft Drink", 21, 120, 70); 
dt.Rows.Add("Mineral Water", 25, 90, 40); 

// clear data series collection
flexChart1.Series.Clear();

// create data series
C1.Win.Chart.Series series1 = new C1.Win.Chart.Series();
C1.Win.Chart.Series series2 = new C1.Win.Chart.Series();
C1.Win.Chart.Series series3 = new C1.Win.Chart.Series();

// add the data series to the data series collection
flexChart1.Series.Add(series1);
flexChart1.Series.Add(series2);
flexChart1.Series.Add(series3);

// specify the datasource for the chart
flexChart1.DataSource = dt;

// bind the X-axis
flexChart1.BindingX = "Beverages";

// bind the Y axes
series1.Binding = "Unit Price";
series2.Binding = "Units In Stock";
series3.Binding = "Units On Order";
            
// name the series
series1.Name = "Unit Price";
series2.Name = "Units In Stock";
series3.Name = "Units On Order";

// set the chart type to bar
flexChart1.ChartType = C1.Chart.ChartType.Bar;