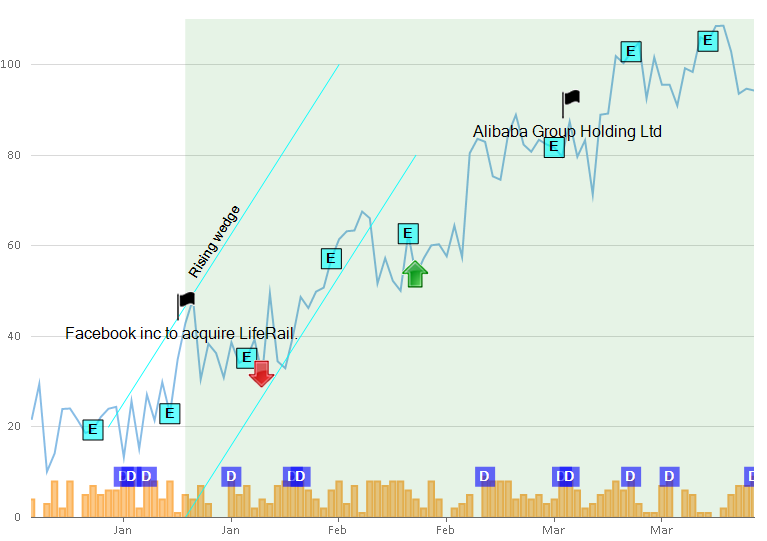
Annotations are visual elements used to mark or highlight specific areas in a chart. They include texts, images, and shapes that can be used to display and highlight important information about specific data points. The primary purpose of using annotations in a chart is to communicate the chart data clearly.
FlexChart provides eight types of annotations in three categories: shape, text, and image annotations. Each annotation type allows you to make chart data informative in different ways. Those include displaying information in circle, rectangle, polygon, and other shapes, and highlighting data through explanatory notes or images.
In addition, annotations in FlexChart can be positioned in the chart using attachment modes, such as Absolute, Relative, Data Index, and Data Coordinate. Both annotations and their content are customizable through styling properties of font, color, and stroke. They can be made interactive by adding tooltips, especially image annotations.

To explore annotations, refer to the following sections:
- Adding Annotations
- Positioning Annotations
- Customizing Annotations
- Types of Annotations
- Creating Callouts