ComponentOne FlexChart for WPF
Axis Scrollbar
FlexChart > Working with FlexChart > End-User Interaction > Axis Scrollbar

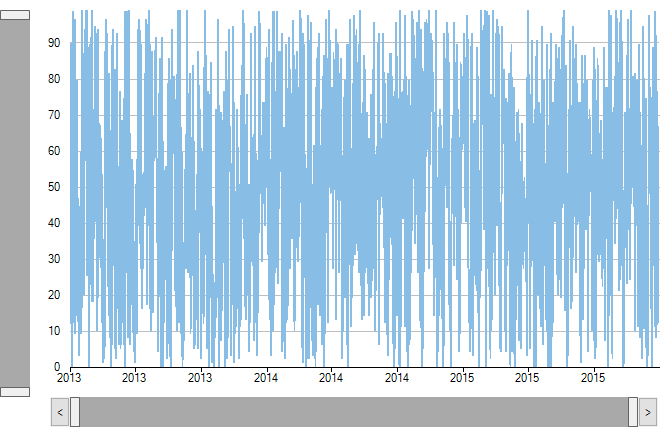
The presence of a large number of values or data in charts makes data interpretation difficult, especially in compact user interfaces.  Axis Scrollbars solve this problem by letting you easily interpret closely related data within a specific range.

FlexChart allows you to add Axis Scrollbar to primary axes (X and Y axes) as well as secondary axes. To add Axis Scrollbar to an axis, you need to create an instance of the C1.WPF.Chart.Interaction.C1AxisScrollbar class.

The  C1AxisScrollbar class provides the ScrollButtonsVisible property that accepts Boolean values to set the visibility of the scrollbar buttons. To set the current lower and the current upper magnitude of the scrollbar, you can use the LowerValue and the UpperValue property provided by C1RangeSlider class respectively. The lower and upper values change when the scrollbar is resized or moved. When any of the LowerValue or the UpperValue property changes, the ValueChanged event provided by the C1RangeSlider class fires.

See the following code snippet for reference:

<c1:Axis.Scrollbar>
    <c1:C1AxisScrollbar x:Name="axisYScrollbar" ScrollButtonsVisible="False" Width="30"/>
</c1:Axis.Scrollbar>
C#
Copy Code
public class AxisScrollbarModel
{
    Random rnd = new Random();

    public List<DataItem> Data
    {
        get
        {
            var pointsCount = rnd.Next(1, 30);
            var pointsList = new List<DataItem>();
            for (DateTime date = new DateTime(DateTime.Now.Year - 3, 1, 1); date.Year < DateTime.Now.Year; date = date.AddDays(1))
            {
                pointsList.Add(new DataItem()
                {
                    Date = date,
                    Series1 = rnd.Next(100)
                });
            }

            return pointsList;
        }
    }
}

VB
Copy Code
Public Class AxisScrollbarModel
    Private rnd As New Random()

    Public ReadOnly Property Data() As List(Of DataItem)
        Get
            Dim pointsCount = rnd.[Next](1, 30)
            Dim pointsList = New List(Of DataItem)()
            Dim [date] As New DateTime(DateTime.Now.Year - 3, 1, 1)
            While [date].Year < DateTime.Now.Year
                pointsList.Add(New DataItem() With {
                    .[Date] = [date],
                    .Series1 = rnd.[Next](100)
                })
                [date] = [date].AddDays(1)
            End While

            Return pointsList
        End Get
    End Property
End Class