Trend lines are an important tool for analyzing data. Trend line indicates the general rate of increase or decrease of Y data over X data in a chart. A common scenario is measuring the rate change of sales price over time. FlexChart control supports trend lines through a built-in TrendLine class for ease of use during implementation. Trend lines are most commonly used in Line, Column, Bar, or Scatter charts.
FlexChart supports the following regression and non-regression trend lines.
| TrendLine.FitType | Description |
|---|---|
| Linear | A linear trend line is the straight line that most closely approximates the data in the chart. The data is linear, if the data pattern resembles a line. Equation - Y(x) = C0 + C1*x |
| Polynomial | Polynomial trend lines are curved lines that are used with fluctuating data. They are useful for analyzing gains or losses over a large data set. When using a polynomial trend line, it is important to also set the Order of the line, which can be determined by the number of fluctuations in the data. Equation - Y(x) = C0 + C1*x + C2*x2 + : + Cn-1*xn-1 |
| Logarithmic | Logarithmic trend line is a best-fit curved line that is most useful when the rate of change in the data increases or decreases quickly and then levels out. A logarithmic trend line can use negative and/or positive values. Equation - Y(x) = C0 * ln(C1*x) |
| Power | Power trend line is a curved line that is best used with data sets that compare measurements that increase at a specific rate — for example, the acceleration of a race car at one-second intervals. You cannot create a power trend line if your data contains zero or negative values. Equation - Y(x) = C0 * pow(x, C1) |
| Exponent | Exponential trend line is a curved line that is most useful when data values rise or fall at increasingly higher rates. You cannot create an exponential trend line if your data contains zero or negative values. Equation - Y(x) = C0 * exp( C1*x) |
| Fourier | Fourier trend line identifies patterns or cycles in a series data set. It removes the effects of trends or other complicating factors from the data set, thereby providing a good estimate of the direction that the data under analysis will take in the future. Equation - Y(x) = C0 + C1 * cos(x) + C2 * sin(x) + C3 * cos(2*x) + C4 * sin(2*x) + ... |
| MinX | The minimum X-value on the chart. |
| MinY | The minimum Y-value on the chart. |
| MaxX | The maximum X-value on the chart. |
| MaxY | The maximum Y-value on the chart. |
| AverageX | The average X-value on the chart. |
| AverageY | The average Y-value on the chart. |
To implement trend line in FlexChart, use the TrendLine class that inherits the Series class. To begin with, create an instance of TrendLine class, and then use the TrendLine object to specify its properties. Once, the associated properties are set, add the trend line to the FlexChart using Series.Add method.
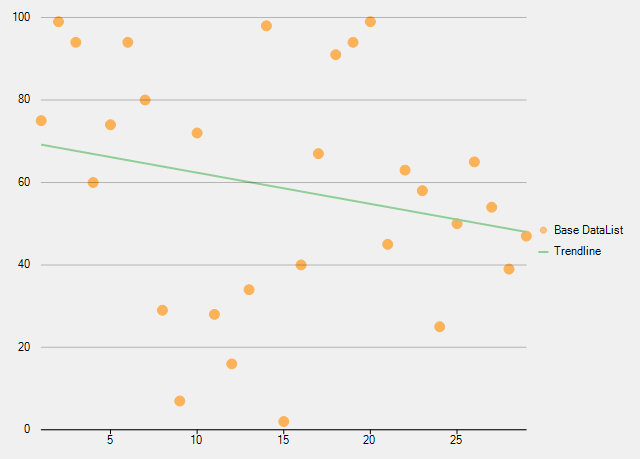
The following image shows how FlexChart appears after adding a linear trend line.