In this step, we will create a new Visual Studio application, add the appropriate references for the project, and add XAML markup to create the FlexChart control.
- Create a new Universal Windows application:
- Select File | New | Project. The New Project dialog box opens.
- Select Templates | Visual C# | Windows | Universal. From the templates list, select Blank App (Universal Windows).
- Give your application a Name and click OK. Your new application in now created.
- Open the MainPage.xaml file and drag and drop the FlexChart control. The following references are added to the project:
- C1.UWP.dll
- C1.UWP.DX.dll
- C1.UWP.FlexChart.dll
The necessary namespaces and control markup are added in the MainPage.xaml as shown:
XAML Copy Code<Page xmlns="http://schemas.microsoft.com/winfx/2006/xaml/presentation" xmlns:x="http://schemas.microsoft.com/winfx/2006/xaml" xmlns:local="using:App1" xmlns:d="http://schemas.microsoft.com/expression/blend/2008" xmlns:mc="http://schemas.openxmlformats.org/markup-compatibility/2006" xmlns:Chart="using:C1.Xaml.Chart" xmlns:Xaml="using:C1.Xaml" xmlns:Foundation="using:Windows.Foundation" x:Class="App1.MainPage" mc:Ignorable="d"> <Grid Background="{ThemeResource ApplicationPageBackgroundThemeBrush}"> <Chart:C1FlexChart x:Name="flexChart" HorizontalAlignment="Left" Height="300" VerticalAlignment="Top" Width="300" Xaml:C1NagScreen.Nag="True"> <Chart:Series Binding="Y" BindingX="X" SeriesName="Series 1"> <Chart:Series.ItemsSource> <PointCollection> <Foundation:Point>1,8</Foundation:Point> <Foundation:Point>2,12</Foundation:Point> <Foundation:Point>3,10</Foundation:Point> <Foundation:Point>4,12</Foundation:Point> <Foundation:Point>5,15</Foundation:Point> </PointCollection> </Chart:Series.ItemsSource> </Chart:Series> <Chart:Series Binding="Y" BindingX="X" SeriesName="Series 2"> <Chart:Series.ItemsSource> <PointCollection> <Foundation:Point>1,10</Foundation:Point> <Foundation:Point>2,16</Foundation:Point> <Foundation:Point>3,17</Foundation:Point> <Foundation:Point>4,15</Foundation:Point> <Foundation:Point>5,23</Foundation:Point> </PointCollection> </Chart:Series.ItemsSource> </Chart:Series> <Chart:Series Binding="Y" BindingX="X" SeriesName="Series 3"> <Chart:Series.ItemsSource> <PointCollection> <Foundation:Point>1,16</Foundation:Point> <Foundation:Point>2,19</Foundation:Point> <Foundation:Point>3,15</Foundation:Point> <Foundation:Point>4,22</Foundation:Point> <Foundation:Point>5,18</Foundation:Point> </PointCollection> </Chart:Series.ItemsSource> </Chart:Series> </Chart:C1FlexChart> </Grid> </Page>
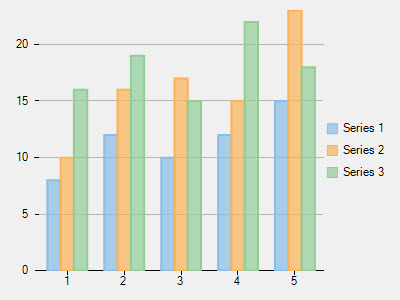
- Run the application. You see the FlexChart as shown below.