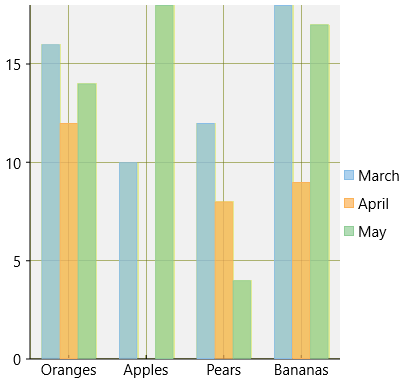
The Plot Area contains data plotted against X-axis and Y-axis.

In FlexChart, the Plot Area can be customized by the following properties provided by the ChartStyle object.
The table below lists the properties available for customizing the Plot Area:
| Property | Description |
|---|---|
| Fill | Sets the color of the Plot Area. |
| FontFamily | Sets the font of the Plot Area. |
| FontSize | Sets the font size in the Plot Area. |
| FontStretch | Sets the font stretch. |
| FontStyle | Sets the font style. |
| FontWeight | Sets the font weight. |
| Stroke | Sets the stroke brush of the Plot Area. |
| StrokeDashArray | Sets the stroke dash array of the Plot Area. |
| StrokeThickness | Sets the stroke thickness of the Plot Area. |
Here is the Xaml for customizing the Plot Area of a chart:
| XAML |
Copy Code
|
|---|---|
<Chart:C1FlexChart.PlotStyle> <Chart:ChartStyle Fill="#FFF1F1F1"/> </Chart:C1FlexChart.PlotStyle> |
|
In addition, FlexChart allows creating multiple plot areas that increase data visibility by displaying a single series in a separate plot area.
For more information about multiple plot areas, see Multiple Plot Areas.