Moving Average Convergence Divergence (MACD) indicator for FinancialChart is a trend-following momentum indicator. It reveals changes in the strength, direction, duration and momentum of price of an asset. The indicator is efficient in helping users spot short-term price momentum.
MACD momentum oscillator displays a relationship between 26 day exponential moving average and 12 day exponential moving average. As the two moving averages converge, cross and diverge, they make the MACD oscillator to fluctuate above and below the zero line. A "signal line" is plotted on the top of the oscillator. It is a 9 day exponential moving average of MACD, which serves as a trigger for buy and sell signals. A sell signal is generated with the MACD going below the zero line.
MACD Histogram is an oscillator which measures the difference between the fast MACD line and the signal line. Just like MACD indicator, histogram also fluctuates above and below zero line. A positive histogram indicates that MACD is above its signal line, while MACD going below its signal line makes a negative histogram. A negative MACD Histograms generates sell signal. To use MACD indicator and MACD Histogram in FinancialChart, add a FinancialChart control to your application and bind it to an appropriate data source. The ItemsSource object enables data binding or populating data in FinancialChart. The MacdBase class exposes FastPeriod, SlowPeriod, and Smoothing period properties. Based on the values of these properties, data points for Macd indicator and Histogram are calculated and plotted on FinancialChart. The appearance of the series can be manipulated with MacdLineStyle and SignalLineStyle properties.
FinancialChart also enables users to fetch the calculated Macd values, Macd x values, Signal values, and Signal x values in the run time, for the purpose of creating alerts in application or maintaining logs while working with dynamic data.
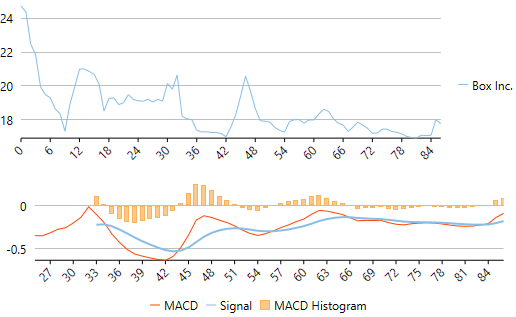
The following example considers stock data for a company Box Inc. over a period of time and plots its MACD Indicator and MACD Histogram apart from the volume chart, as shown in the image above. The example uses data from a json file, and DataService.cs class is created to access this json file.
Make sure to add the following references in DataService.cs:
- System.Collections.Generic
- System.Linq
- System.Runtime.Serialization.Json
- System.Reflection
Json Data
[
    { "date": "01/23/15", "open": 20.2, "high": 24.73, "low": 20.16, "close": 23.23, "volume": 42593223 },
    { "date": "01/26/15", "open": 23.67, "high": 24.39, "low": 22.5, "close": 22.6, "volume": 8677164 },
    { "date": "01/27/15", "open": 22, "high": 22.47, "low": 21.17, "close": 21.3, "volume": 3272512 },
    { "date": "01/28/15", "open": 21.62, "high": 21.84, "low": 19.6, "close": 19.78, "volume": 5047364 },
    { "date": "01/29/15", "open": 19.9, "high": 19.95, "low": 18.51, "close": 18.8, "volume": 3419482 },
    { "date": "01/30/15", "open": 18.47, "high": 19.48, "low": 18.22, "close": 18.81, "volume": 2266439 },
    { "date": "02/02/15", "open": 19.18, "high": 19.3, "low": 18.01, "close": 18.02, "volume": 2071168 },
    { "date": "02/03/15", "open": 18.22, "high": 18.64, "low": 18.12, "close": 18.24, "volume": 1587435 },
    { "date": "02/04/15", "open": 18.2, "high": 18.35, "low": 17, "close": 17.1, "volume": 2912224 },
    { "date": "02/05/15", "open": 17.3, "high": 17.31, "low": 16.41, "close": 16.66, "volume": 2682187 },
    { "date": "02/06/15", "open": 17.39, "high": 18.88, "low": 17.21, "close": 18.12, "volume": 3929164 },
    { "date": "02/09/15", "open": 18.86, "high": 19.95, "low": 18.45, "close": 19.6, "volume": 3226650 },
    { "date": "02/10/15", "open": 20.5, "high": 21, "low": 19.63, "close": 20.99, "volume": 2804409 },
    { "date": "02/11/15", "open": 20.89, "high": 21, "low": 20.2, "close": 20.96, "volume": 1698365 },
    { "date": "02/12/15", "open": 20.66, "high": 20.85, "low": 19.75, "close": 20.17, "volume": 1370320 },
    { "date": "02/13/15", "open": 20.19, "high": 20.68, "low": 20, "close": 20.18, "volume": 711951 },
    { "date": "02/17/15", "open": 19.5, "high": 20.1, "low": 18.8, "close": 19.05, "volume": 2093602 },
    { "date": "02/18/15", "open": 18.31, "high": 18.5, "low": 17.96, "close": 18, "volume": 1849490 },
    { "date": "02/19/15", "open": 18.33, "high": 19.25, "low": 17.91, "close": 18.96, "volume": 1311518 },
    { "date": "02/20/15", "open": 18.68, "high": 19.3, "low": 18.65, "close": 18.85, "volume": 1001692 },
    { "date": "02/23/15", "open": 18.8, "high": 18.89, "low": 18.11, "close": 18.21, "volume": 670087 },
    { "date": "02/24/15", "open": 18.46, "high": 19, "low": 18.27, "close": 18.83, "volume": 759263 },
    { "date": "02/25/15", "open": 18.83, "high": 19.48, "low": 18.47, "close": 18.67, "volume": 915580 },
    { "date": "02/26/15", "open": 18.64, "high": 19.2, "low": 18.64, "close": 18.94, "volume": 461283 },
    { "date": "02/27/15", "open": 18.8, "high": 19.12, "low": 18.55, "close": 18.66, "volume": 617199 },
    { "date": "03/02/15", "open": 18.66, "high": 19.09, "low": 18.65, "close": 18.79, "volume": 519605 },
    { "date": "03/03/15", "open": 18.79, "high": 19.21, "low": 18.45, "close": 18.59, "volume": 832415 },
    { "date": "03/04/15", "open": 18.64, "high": 19.05, "low": 18.32, "close": 19, "volume": 539688 },
    { "date": "03/05/15", "open": 19.2, "high": 19.2, "low": 18.8, "close": 19.14, "volume": 486149 },
    { "date": "03/06/15", "open": 19.03, "high": 19.1, "low": 18.7, "close": 18.91, "volume": 685659 },
    { "date": "03/09/15", "open": 18.98, "high": 20.15, "low": 18.96, "close": 19.4, "volume": 1321363 },
    { "date": "03/10/15", "open": 19.3, "high": 19.8, "low": 18.85, "close": 19.64, "volume": 615743 },
    { "date": "03/11/15", "open": 20.08, "high": 20.65, "low": 19.24, "close": 20.53, "volume": 2167167 },
    { "date": "03/12/15", "open": 17.17, "high": 18.2, "low": 16.76, "close": 18.2, "volume": 6837638 },
    { "date": "03/13/15", "open": 18.05, "high": 18.05, "low": 17.3, "close": 17.88, "volume": 1715629 },
    { "date": "03/16/15", "open": 17.91, "high": 18, "low": 17.01, "close": 17.13, "volume": 1321313 },
    { "date": "03/17/15", "open": 17.28, "high": 17.37, "low": 16.6, "close": 17.12, "volume": 1272242 },
    { "date": "03/18/15", "open": 17.1, "high": 17.27, "low": 16.91, "close": 17.01, "volume": 530063 },
    { "date": "03/19/15", "open": 17, "high": 17.28, "low": 17, "close": 17.06, "volume": 536427 },
    { "date": "03/20/15", "open": 17.13, "high": 17.24, "low": 16.88, "close": 17.21, "volume": 1320237 },
    { "date": "03/23/15", "open": 17.21, "high": 17.23, "low": 17.01, "close": 17.11, "volume": 509798 },
    { "date": "03/24/15", "open": 17.02, "high": 17.18, "low": 16.82, "close": 17, "volume": 962149 },
    { "date": "03/25/15", "open": 16.92, "high": 16.99, "low": 16.82, "close": 16.97, "volume": 565673 },
    { "date": "03/26/15", "open": 16.83, "high": 17.56, "low": 16.83, "close": 17.54, "volume": 884523 },
    { "date": "03/27/15", "open": 17.58, "high": 18.3, "low": 17.11, "close": 18.3, "volume": 705626 },
    { "date": "03/30/15", "open": 18.5, "high": 19.4, "low": 18.4, "close": 19.05, "volume": 1151620 },
    { "date": "03/31/15", "open": 19.08, "high": 20.58, "low": 18.4, "close": 19.75, "volume": 2020679 },
    { "date": "04/01/15", "open": 19.69, "high": 19.69, "low": 18.55, "close": 18.65, "volume": 961078 },
    { "date": "04/02/15", "open": 18.56, "high": 18.66, "low": 17.85, "close": 17.9, "volume": 884233 },
    { "date": "04/06/15", "open": 17.78, "high": 17.94, "low": 17.51, "close": 17.66, "volume": 605252 },
    { "date": "04/07/15", "open": 17.62, "high": 17.9, "low": 17.53, "close": 17.61, "volume": 591988 },
    { "date": "04/08/15", "open": 17.64, "high": 17.85, "low": 17.32, "close": 17.36, "volume": 618855 },
    { "date": "04/09/15", "open": 17.33, "high": 17.54, "low": 17.1, "close": 17.1, "volume": 761855 },
    { "date": "04/10/15", "open": 17.08, "high": 17.36, "low": 17, "close": 17.05, "volume": 568373 },
    { "date": "04/13/15", "open": 17.24, "high": 17.26, "low": 16.81, "close": 17.1, "volume": 667142 },
    { "date": "04/14/15", "open": 17.1, "high": 17.89, "low": 17.02, "close": 17.52, "volume": 870138 },
    { "date": "04/15/15", "open": 17.6, "high": 17.99, "low": 17.5, "close": 17.69, "volume": 530456 },
    { "date": "04/16/15", "open": 17.95, "high": 18, "low": 17.6, "close": 17.82, "volume": 548730 },
    { "date": "04/17/15", "open": 17.75, "high": 17.79, "low": 17.5, "close": 17.79, "volume": 446373 },
    { "date": "04/20/15", "open": 17.63, "high": 17.98, "low": 17.52, "close": 17.93, "volume": 487017 },
    { "date": "04/21/15", "open": 17.96, "high": 17.98, "low": 17.71, "close": 17.92, "volume": 320302 },
    { "date": "04/22/15", "open": 17.88, "high": 18.33, "low": 17.57, "close": 18.29, "volume": 644812 },
    { "date": "04/23/15", "open": 18.29, "high": 18.61, "low": 18.18, "close": 18.28, "volume": 563879 },
    { "date": "04/24/15", "open": 18.5, "high": 18.5, "low": 17.61, "close": 17.75, "volume": 650762 },
    { "date": "04/27/15", "open": 17.97, "high": 18.05, "low": 17.45, "close": 17.57, "volume": 437294 },
    { "date": "04/28/15", "open": 17.65, "high": 17.79, "low": 17.39, "close": 17.5, "volume": 224519 },
    { "date": "04/29/15", "open": 17.68, "high": 17.68, "low": 17.1, "close": 17.21, "volume": 495706 },
    { "date": "04/30/15", "open": 17.22, "high": 17.3, "low": 17, "close": 17.11, "volume": 391040 },
    { "date": "05/01/15", "open": 17.11, "high": 17.55, "low": 16.85, "close": 17.5, "volume": 563075 },
    { "date": "05/04/15", "open": 17.56, "high": 17.85, "low": 17.3, "close": 17.4, "volume": 253138 },
    { "date": "05/05/15", "open": 17.68, "high": 17.68, "low": 17.09, "close": 17.43, "volume": 290935 },
    { "date": "05/06/15", "open": 17.48, "high": 17.48, "low": 17, "close": 17.04, "volume": 313662 },
    { "date": "05/07/15", "open": 17.05, "high": 17.19, "low": 16.92, "close": 17.04, "volume": 360284 },
    { "date": "05/08/15", "open": 17.13, "high": 17.21, "low": 16.91, "close": 17.1, "volume": 297653 },
    { "date": "05/11/15", "open": 17.16, "high": 17.44, "low": 17.13, "close": 17.31, "volume": 268504 },
    { "date": "05/12/15", "open": 17.28, "high": 17.44, "low": 16.99, "close": 17.24, "volume": 376961 },
    { "date": "05/13/15", "open": 17.24, "high": 17.3, "low": 17.06, "close": 17.2, "volume": 244617 },
    { "date": "05/14/15", "open": 17.24, "high": 17.25, "low": 17.02, "close": 17.08, "volume": 252526 },
    { "date": "05/15/15", "open": 17.06, "high": 17.16, "low": 16.95, "close": 16.95, "volume": 274783 },
    { "date": "05/18/15", "open": 16.95, "high": 17.01, "low": 16.76, "close": 16.87, "volume": 418513 },
    { "date": "05/19/15", "open": 16.93, "high": 16.94, "low": 16.6, "close": 16.83, "volume": 367660 },
    { "date": "05/20/15", "open": 16.8, "high": 16.9, "low": 16.65, "close": 16.86, "volume": 297914 },
    { "date": "05/21/15", "open": 16.9, "high": 17.08, "low": 16.79, "close": 16.88, "volume": 229346 },
    { "date": "05/22/15", "open": 16.9, "high": 17.05, "low": 16.85, "close": 17, "volume": 253279 },
    { "date": "05/26/15", "open": 17.03, "high": 17.08, "low": 16.86, "close": 17.01, "volume": 212640 },
    { "date": "05/27/15", "open": 17.01, "high": 17.99, "low": 16.87, "close": 17.75, "volume": 857109 },
    { "date": "05/28/15", "open": 17.77, "high": 17.77, "low": 17.44, "close": 17.62, "volume": 338482 }
            ]
Make sure to add the following references in code view:
- System.Collections.Generic
- System.Windows
- System.Runtime.Serialization