In addition to the DataX and DataY properties mentioned above, the Chart object provides a few other properties that are commonly used:
• ChartType: This property allows you to select the type of chart to display. There are six options: Bar (horizontal bars), Column (vertical columns), Scatter (X-Y values), Line, Area, and Pie.
• DataColor: This property selects the color used to draw the bars, columns, areas, scatter symbols, and pie slices. If the chart contains multiple series, then the Chart field automatically generates different shades of the selected color for each series. If you want to select specific colors for each series, use the Palette property instead, and set its value to a semi-colon separated list containing the colors to use (for example "Red;Green;Blue").
• FormatY, FormatX: These properties determine the format used to display the values along each axis. For example, setting FormatY to "c" causes the Chart field to format the values along the Y axis as currency values. This is analogous to the Format property in regular report fields.
• XMin, XMax, YMin, YMax: These properties allow you to specify ranges for each axis. Setting any of them to -1 cause the Chart to calculate the range automatically. For example, if you set the YMax property to 100, then any values higher than 100 will be truncated and won't appear on the chart.
These properties apply to all chart types. There are a few additional properties that only apply to Pie charts:
• ShowPercentages: Each pie slice has a legend that shows the X value for the slice. If the ShowPercentages property is set to true, the legend will also include a percentage value that indicates the size of the slice with respect to the pie. The percentage is formatted using the value specified by the FormatY property. For example, if you set FormatY to "p2", then the legends will include the X value and the percentage with two decimal points (for example "North Region (15.23%)").
• RadialLabels: This property specifies that instead of showing a legend on the right side of the chart, labels with connecting lines should be attached to each slice. This works well for pies with few slices (up to about ten).
The Chart field is actually a wrapper for a C1Chart control, which provides all the charting services and has an extremely rich object model of its own. If you want to customize the Chart field even further, you can use the ChartControl property to access the inner C1Chart object using scripts.
For example, the Chart field does not have a property to control the position of the legend. But the C1Chart control does, and you can access this property through the ChartControl property. For example, the script below causes the chart legend to be positioned below the chart instead of on the right:
' place legend below the
chart
chartField.ChartControl.Legend.Compass = "South"
If you assign this script to the report's OnLoad property, the chart will look like the image below:
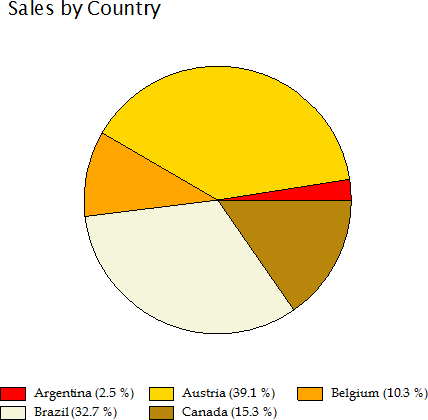
The other properties used to create these chart are as follows:
ChartType = Pie
FormatY =
"p1"
ShowPercentage = true
Palette =
"Red;Gold;Orange;Beige;DarkGoldenrod;Goldenrod;"
|