 Show All
 Hide All
Categories group your data and provide labels for your chart elements. Labels appear along the Y axis in a bar chart, or along the X axis in a column chart.
By default, each chart has one category that is the same as the original attribute you drag onto the report design surface to create the chart. You can add new categories, change the default category, change the order of categories, and delete categories.
Multiple categories are nested, and each data field is displayed within each category.
To change the default category
- Click the chart to reveal the adorners.
- Click the drop-down arrow icon next to the default Category Invoice below the chart. The Invoice entity appears with an arrow icon to its left.
- Click the arrow icon to the left of the Invoice entity to reveal the entities and attributes that you can use for a category grouping.

- Double-click the attribute or entity that you want to replace the existing category. When you preview the report, the new category grouping is displayed along the same axis as the original data field.
To add a new category
- Click the chart to reveal the adorners.
- Click Add a category below the chart. The Invoice entity appears with an arrow icon to its left.
- Click the arrow icon to reveal the entities and attributes that you can use for a category grouping.
- Double-click an attribute or entity to add it as a Category below the existing category. The new category grouping is displayed along the same axis as the original data field.
 |
Note: Another way to add a category is to drag an attribute or entity from the Attribute Tree (or Entity Tree) and drop it onto the Categories area. A red X icon appears when you drag it over an area where you cannot drop the item, and a bold blue line appears where the category will be added when you drag it over an area where you can drop it. |
To change the order of categories
If there is more than one category in the chart, you can change the order.
- Click the chart to reveal the adorners.
- Click the category that you want to move to expand the category work area.
- To the right of the category name, up or down arrow buttons are enabled depending on whether there are additional categories above or below the selected category. Click the up arrow to move the selected category above the preceding category, or click the down arrow to move it below the following category.
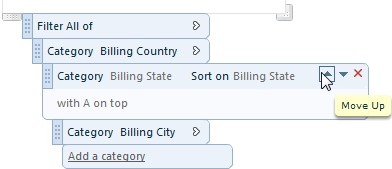
- Alternatively, you can click the grab handle to the left of the category that you want to move.

- The pointer changes to a four-way arrow, and you can drag the category up or down to the desired location. A red X icon appears when you drag it over a place where you cannot drop the category, and a bold blue line appears where the category will be inserted when you drag it over an area where you can drop it.
To delete a category
You can only delete a category if there is more than one in the chart.
- Click the chart to reveal the adorners.
- Click the expansion arrow to the right of the Category that you want to delete.
- In the expanded Category area that appears, click the red X icon on the right.
See Also