The Chart data region shows your data in a graphical representation that often makes it easier for users to comprehend large amounts of data quickly. Different types of charts are more efficient for different types of information, so we offer a wide variety of chart types. This makes it easy and cost effective to add charting to your reports, as there is no need to purchase and integrate a separate charting tool.
Following are the areas where you drop fields in order to plot data in a chart,
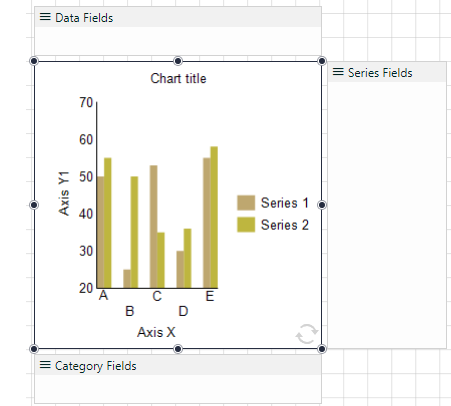
- Data Fields
- Add fields to data fields area to serve as source for plotting chart data points along Y-axis.
- Category Fields
- Add fields to category fields area to group data and plot the measures for category axis or X-axis.
- Series Fields
- Add fields to the series fields area to display data in addition to the data plotted by each category. There can be different chart types to view different series on a chart. The labels for the series are displayed on the legend of the chart.
See Also