A Tablix data region displays data in cells that are arranged in rows and columns. It provides enhanced layout capabilities ranging from creation of simple tables to advanced matrices. Tablix is essentially a combination of two data regions, the table and the matrix. Therefore, it provides all the features of a table and a matrix along with added capabilities including support for multiple adjacent groups on rows or columns and improved layout flexibility with stepped group layouts.
Areas of the Tablix Data Region
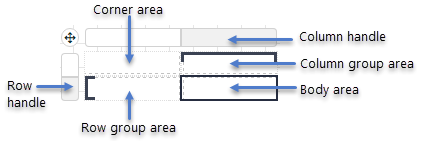
The Tablix data region is composed of four areas denoted by dotted lines on the design surface: the corner, the row group area, the column group area, and the body. By default, each tablix cell contains a TextBox control and the function for each cell is determined by its location. The Group Editor is specifically designed to manage the tablix structure. The Group Editor window contains the following groups:
- Row Groups: Displays all the groups in the row group area of the Tablix data region.
- Column Groups: Displays all the groups in the column group area of the Tablix data region.
When you select a Tablix data region, the row and column handles appear. These handles help you work with the groups added to the data region.
Rows or columns in the Tablix data region can be static or dynamic. You can use the Group Editor window to identify the dynamic rows and columns in a Tablix data region.
Static Rows and Columns: A static row or column is not associated with any group data. When the report runs, a static row or column is rendered only once. Labels and totals are displayed using static rows or columns in Tablix data region.
Dynamic Rows and Columns: A dynamic row or column is associated with one or more groups, and renders once for every unique value in the group. You can also create dynamic group rows or columns by adding a row group or a column group.