Page reports define reports as fixed page layouts. You can use the same page layout throughout the report or design more page layouts for complex reports. Page reports are saved in RDLX format.
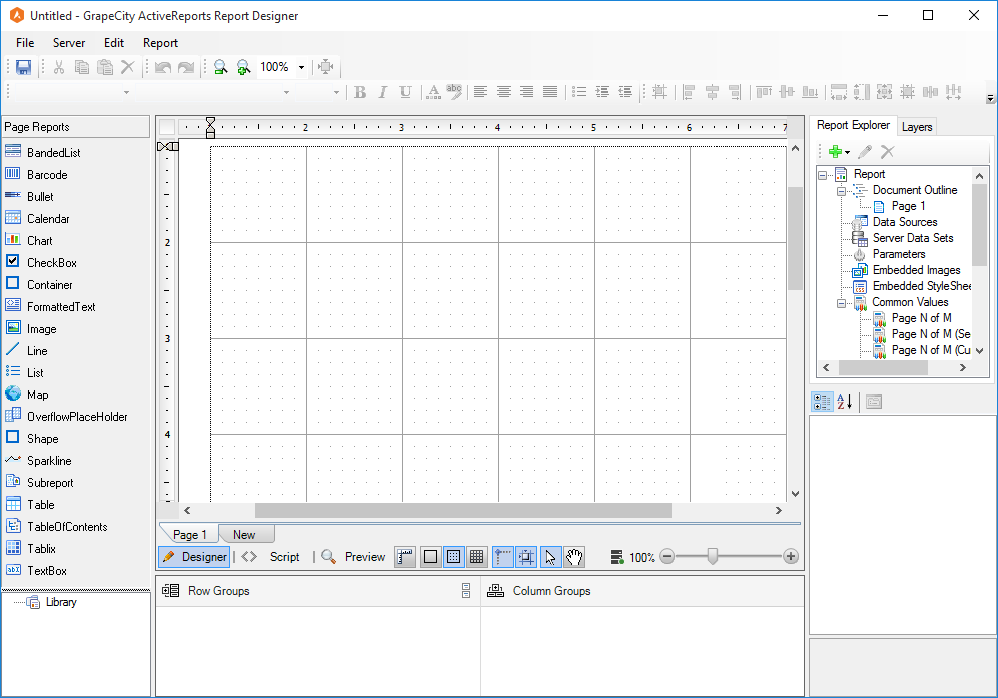
Designer tabs
The Designer has three tabs located at the bottom of the report design surface. Create a report layout in the Designer tab, write script in the Script tab to implement .NET functionality and see the results in the Preview tab.
- Designer tab: Appears by default when you open a report in the designer. Use this tab to visually design your report layout. You can implement design-time features here, drag controls from the toolbox to create a layout, bind data regions to data, and set properties for the report and controls through the context menu.
- Script tab: Opens the script editor, where you can add .NET functionality to reports without compiling .vb or .cs files. You can use Visual Basic script in this tab with RDL and Page reports. Section reports support C# script as well as Visual Basic script. In Page and RDL reports, you can embed code blocks to reference in the expressions you use on report controls. In Section reports, you can add code to object events.
- Preview tab: Allows you to view your report.
Designer buttons
Designer buttons, located to the right of the designer tabs along the bottom of the designer, are enabled when you are on the Designer tab. They allow you to control settings for the design surface.
- Dimension Lines: Dimension lines appear during a drag operation, and run from the borders of the report control or data region being moved or resized to the edges of the report designer surface. Dimension lines let you track the location of the control as you move it by displaying the distance between the control and the edge of the writable area of the report.
- Hide Grid: By default, grid lines or dots appear on the report design surface. Select this option to design your report on a blank page. Although lines and dots do not appear when you hide the grid, Snap to Lines and Snap to Grid settings are unaffected.
- Show Dots: Select this option to use dots on the design surface to indicate the grid to guide you in the placement of controls.
- Show Lines: Select this option to use faint grey lines on the design surface to indicate the grid to guide you in the placement of controls.
- Snap Lines: Aligns the control you are dragging with other controls on the report design surface. When you drag the control around, snap lines appear when it is aligned with other controls or with the edges of the report, and when you drop it, it snaps into place in perfect alignment.
- Snap to Grid: Aligns the control you are dragging with grid lines on the report design surface. When you drop the control, it snaps into place in alignment with the nearest grid mark. To place your controls freely on the report design surface, turn this setting off.
- Select Mode: Selects an item on the report designer surface on clicking it. Use this mode for editing, data binding, and styling in the Designer tab.
- Pan Mode: Makes navigation easier in a report with many controls that you do not want to disturb. In this mode, you cannot select, edit, add, or delete controls, but you can navigate through the report by pressing the left mouse button and dragging the report to the desired position.
Page tabs (Page report only)
Page tabs appear in an Excel-like bar below the report design surface. This feature is only available in Page reports, where you design report layouts on separate pages and control the way each page appears. Using page tabs, you can select which page to view or edit, add new pages, remove existing pages, reorder pages, and create duplicate pages.
By default, a new report has a Page 1 tab and a New tab.
- Page 1: This is the layout for the first page of the report. If no other page layouts exist, this page layout applies to the entire report.
- New: Click to add a new page where you can create a layout for pages displayed after the first page.
Right-click any page tab (except the New tab) to get a context menu that allows you to Insert a new page, Duplicate the page, or Delete the page.
Toolbar
Contains buttons and dropdown lists for a number of commonly used commands. Toolbar options differ slightly depending on the report type. The commands for
- Text decoration: Style, Font, Font Size, Fore color, Back Color, Bold, Italic, Underline.
- Layout editing: Zoom Out, Zoom In, Zoom.
- Control alignment: Align to Grid, Align Lefts, Align Rights, Align Tops, Align Middles, Align Bottoms.
- Control resizing: Make Same Width, Make Same Height, Make Same Size, Size to Grid.
- Control spacing: Make/Remove Horizontal/Vertical Spacing Equal, Increase/Decrease Horizontal/Vertical Spacing.
Report Explorer
The Report Explorer gives you a visual overview of report elements in the form of a tree view where each node represents a report element. Section, RDL, and Page reports are composed of different types of report elements. Using the Report Explorer with any type of report, you can remove controls, add, edit, or remove data sources and parameters, and drag fields onto the report. You can also select the report or any element of the report to display in the Properties Window, where you can modify its properties.
Toolbox
The Designer toolbox tabs display all of the controls specific to the type of report that has focus.
When a Section report has focus, the Section Report toolbox becomes available. For information about the report controls available in this toolbox, please see the Supported Controls (Section Report) topic in the User Guide.
When a Page or an RDL report has focus, the Page Report or RDL toolbox becomes available. For information about the report controls available in these toolboxes, please see the Supported Controls topic in the User Guide.
Properties Window
The Properties window is an important tool when you design a report. Select any page, section, data region, control, or the report itself to gain access to its properties in the Properties window. You can sort the properties by category or in alphabetical order by clicking the buttons at the top of the Properties window. Select a property to reveal a description at the bottom of the window. Just above the description is a commands section that contains commands, links to dialogs that give you access to further properties for the item. You can resize the commands or description sections by dragging the top or bottom edges up or down.
Rulers
In ActiveReports, rulers appear at the top and left of the Design View to guide you in vertically and horizontally aligning items in the report. They have large tick marks to indicate half inch points and smaller tick marks to indicate eighths of an inch.
Scroll Bars
Scroll bars appear automatically when controls or data regions do not fit within the visible area of the report design surface. A scroll bar consists of a shaded column with a scroll arrow at each end and a scroll box (also called a thumb) between the arrows. You can scroll up, down, right or left using the scroll arrow buttons, scroll box or mouse wheel.
Zoom Slider
ActiveReports allows you to zoom in or out on the report design surface for better control over your report layout. As you zoom in or out, the apparent size of every item on the design surface changes proportionately. In the designer, the Zoom bar is below the report design surface. The slider thumb is set to 100% by default. Use the slider to show the layout at any zoom level from 50% to 400%. You can also use the zoom in (+) and zoom out (-) buttons at either end of the slider.