The Map sample demonstrates the basic functioning of the Map control with the help of four reports that explain the different features of the control. This sample is part of the ActiveReports Professional Edition.
Sample Location
Visual Basic.NET
<User Folder>\GrapeCity Samples\ActiveReports 13\DesignerPro\Map\VB.NET
C#
<User Folder>\GrapeCity Samples\ActiveReports 13\DesignerPro\Map\C#
Details
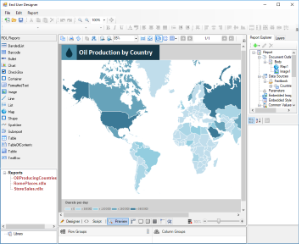
When you run this sample, the End User Designer shows a list of .rdlx reports at the bottom left of the form. Expand the Reports node to view reports under it and double-click a report to load it into the designer.
Report FormThis is the main form that appears when you run the sample. This form uses the ToolStripPanel, ToolStripContentPanel, Designer, Toolbox, ReportExplorer and PropertyGrid controls to create a customized ReportDesigner.
Right-click the form and select View Code to see how to set up the designer and create a blank page report. It also contains code that adds the reports to the TreeView control, loads a report into the Designer when the report is double-clicked, and checks for any modifications that have been made to the report in the designer.
OilProducingCountries.rdlx: This report uses the FactBook shared data source connection to provide data.
It contains a Map control that visually displays the oil production in different countries of the world on a virtual earth background. The map control uses the color rule set on a polygon layer to differentiate parts of world according to their oil production capacity. These colors are defined using a color rule which is described in the legend at run time.
RomePlaces.rdlx: This report contains a Map control that visually displays famous places in Rome.
The map control uses Google maps in a Tile layer to provide a virtual earth background and a Point layer to plot famous places on the map using image markers. Clicking the image marker opens the web page for the selected place in Wikipedia.
StoreSales.rdlx: This report contains a Map control that visually displays the sales of different stores in the US.
The Map control uses the built-in USA map template. The polygon layer defines the country and state boundaries while the point layer is used to plot store locations. The Point layer uses the marker size rule to differentiate stores according to their profits. The different sized markers used for plotting stores are defined in a legend that appears on the map at run time. The point layer also uses the drill-through link (the Action is set to Jump to report) that opens a specific store report (StoreReport2.rdlx) when the marker is clicked.
StoreReport2.rdlx: This report uses the Reels shared data source connection to provide data.
It opens on clicking a specific store location that is indicated with a marker. The Table data region in the report uses a drill-down link to display the list of employees in the selected store. The report uses the chart data region to display the sales for the store. The Reels logo that appears on the report in the Image control is embedded within the Reels theme.