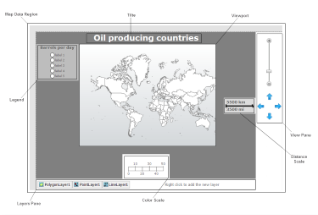
The Map data region shows your business data against a geographical background. This topic illustrates how to create a Map and modify its appearance.
These steps assume that you have added a page layout template to your project and have a data connection in place. See Adding an ActiveReport to a Project and Connect to a Data Source for further information.
To add a map to the report
- From the Visual Studio toolbox, drag a Map control onto the design surface.
-
In the Select a Map Template wizard that appears, select a map template from the following options:
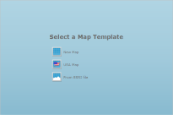
- Empty map: An empty map without any predefined data.
- USA map: A map with the predefined polygon layer that contains the embedded spatial data with the USA map.
- From ESRI file: Select from your local .shp file, the shapefile spatial data format that complies with the Environmental Systems Research Institute, Inc. (ESRI). An ESRI Shapefile is a collection of files, where a .shp file defines the geographical or geometrical shapes and the .dbf file provides attributes for the shapes in the .shp file. To successfully add spatial data using this option, both files (.shp and .dbf) must be copied to the same folder. ESRI files are available on public domain data sources on the Web, including government and university sites. For more information, go to www.census.gov/geo/maps-data/data/tiger.html.
To modify the appearance of the map
- On the design surface, select the Map control and click the Property dialog link in the command section that appears below the properties window.
-
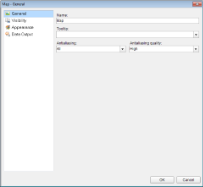
In the Map dialog that appears, on the General page, enter "Map" in the Name textbox. You can also make modifications in properties that control the smoothing mode of all map elements (Antialiasing and Antialiasing quality).
-
On the Visibility page of the dialog, you can setup the visibility mode of the map.
-
On the Appearance page of the dialog, you can make modifications to the border width, style, color and background color.
-
On the Data Output page of the dialog, choose from Auto, Yes or No to decide whether to include this map in the XML output. Also, if you choose to include this map in the XML output, then in Element Name, enter a name to be used in the XML output for this map. Choosing Auto will include the map in the XML output.
-
Click OK to close the dialog.
To add a legend to the map
A legend on a map provides valuable information to users for interpreting the map data visualization rules such as color, size, and marker type differences for map elements on a layer. By default, a single Legend item already exists in the legends collection which can be used by all layers to display items. You can also create additional legends to use them individually with layers that have associated rules to display items in the legend. Use these steps to learn adding and setting a legend on a map:
- On the design surface, select the Map control.
- In the Properties window, click the Legends (Collection) property and then click the ellipsis (...) button that appears.
-
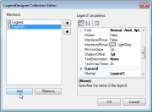
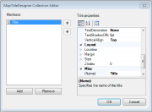
In the LegendDesigner Collection Editor that appears, click Add under the Members list of legends. Legend1 with the default legend settings appears in the Members list.
-
With Legend1 selected in the Members list of legends, you can make modifications to its font, border and background color settings.
-
Click OK to close the dialog.
Note: You can associate the newly added legend to a layer by specifying its name in the Legend Name field that appears in the Legend tab on a specific rule page of a Layer dialog. See, Use Color Rule, Marker Rule and Size Rule for more information.
To add a title to the map
Map Title describes the theme or subject of the map. The purpose of map title is to tell the viewer of what he is looking at. Use these steps to learn adding a title on a map control.
- On the design surface, select the Map control.
- In the Properties window, click the Titles (Collection) property and then click the ellipsis (...) button that appears.
-
In the MapTitleDesigner Collection Editor that appears, in the Members list of titles, Title with the default property settings already exist.
-
In the Properties Window, you can modify the text, font, border and the background color settings of the map title.
-
Click OK to close the dialog.
To set the distance scale
A distance scale helps a user to understand the scale of the map. Distance on a map is not the same as the actual real-world distance, so a distance scale shows that a certain distance on the map equals a certain distance in a real-world. In distance scale, the distance is displayed in both miles and kilometers. The scale range and values are automatically calculated using the viewport boundaries, projection type, and zoom level. Use these steps to learn setting a distance scale on a map:
- On the design surface, select the Map control.
- In the Properties window, click the DistanceScale property and then click the ellipsis (...) button that appears.
-
In the Map Distance Scale dialog that appears, on the General page, you can set the location and the color of the distance scale.
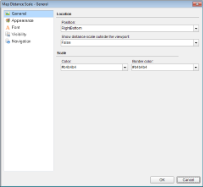
- On the Appearance page of the dialog, you can make modifications to the border width, style, color and background color.
- On the Font page of the dialog, you can make modifications to the font properties of the distance scale.
- On the Visibility page of the dialog, you can setup the visibility mode of the distance scale.
- On the Navigation page of the dialog, you can setup the interactivity features for the distance scale.
- Click OK to close the dialog.
To set the color scale
A color scale helps a user to understand the range of colors that are used for data visualization on a layer. A map has just one color scale and multiple layers can provide data for it. Use these steps to learn setting a color scale on a map.
- On the design surface, select the Map control.
- In the Properties window, click the ColorScale property and then click the ellipsis (...) button that appears.
-
In the Map Color Scale dialog that appears, on the General page, you can set the location and the color of the color scale.
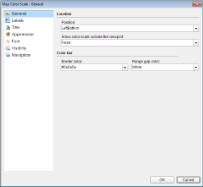
- On the Labels page of the dialog, you can make modifications to the properties of the color scale labels.
- On the Title page of the dialog, you can make modifications to title text and font properties of the color scale.
- On to the Appearance page, you can make modifications to the border width, style, color and background color.
- On the Font page, you can make modifications to the font properties of the color scale.
-
On the Visibility page, you can setup the visibility mode of the color scale.
-
On the Navigation page, you can setup the interactivity features for the color scale.
-
Click OK to close the dialog.
To modify the appearance of the Viewport
Viewport refers to the area on the map where map data is displayed against a geographical background. It specifies the coordinates, projection system, parallels and meridians, center point, and scale of the map. In other words, it is a map element that actually display geographical data and occupies most area of the map control depending on the location and dock position of other map elements. See Map for more information.
You can modify Viewport properties to make the map look more attractive.
- On the design surface, select the Map control.
- Go to the Properties window, click the Viewport property and then click the ellipsis (...) button that appears.
-
In the Map Viewport dialog that appears, on the General page, choose the Coordinate system. The map viewport supports the following two coordinate system:
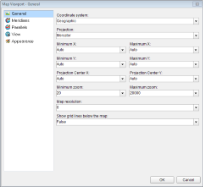
- Geographic: Specifies Earth coordinates by defining longitude and latitude values. If you set the CoordinateSystem property to Geographic, then you must specify the Projection property. A projection is a set of rules on how to locate three-dimensional objects onto a planar surface.
- Planar: Specifies geometric coordinates on a two-dimensional surface by using X and Y values. and in case you set it to Geographic then set the Projection.
- Go to the Meridians page, set its visibility and its line and font style and color.
- Similarly, go to the Parallels page, set its visibility and its line and font style and color.
- On the View page of the dialog, choose a Center and Zoom mode. The map viewport supports the following four center and zoom modes:
- Custom: Choose this option to specify custom values for the view center and the zoom level.
- Center map to show a map layer: Choose this option to specify a layer and automatically, center the view on its map data. For example, center the view on LineLayer1.
- Center map to show a map element: Choose this option to center the view on a specific data bound map element. For example, center the view on the map element where the name of the match field is [StateName] and the match value is "Washington".
- Center map to show all map elements: Choose this option to center the view on all map elements in the layer.
Note: Zoom and View Center level can also be set from the design surface using the zoom slider and arrow keys that appears in the View Pane of the Map control. - On the Appearance page, set the Border and Background style and color of the viewport.
-
Click OK to close the dialog.
See Also