A Line layer displays routes and paths between different locations, for example, transportation route between two stores.
Use the following steps for creating a basic map using the Point layer. These steps assume that you have added a page layout template to your project and have a data connection in place. See Adding an ActiveReport to a Project and Connect to a Data Source for further information.
- From the Visual Studio toolbox, drag and drop a Map control onto the design surface.
- In the Select a Map Template wizard that appears, select the New Map template.
- Click the map until the map panes appear.
- Right click inside the area labeled "Right click to add the new layer." and add either a Tile layer or a Polygon layer. One of these layers that you add serves as the geographic base to plot lines on. See, Use a Polygon Layer or Use a Tile Layer for steps to add these layers on a Map control.
- Right click again inside the area labeled "Right click to add the new layer." and select Add Line Layer. This adds a Line layer to the map and opens the Map Layer Data Properties dialog.
- In the Map Layer Data Properties dialog that appears, on the General page, import the spatial data (lines) from a shape file or use a data field from the analytical data to specify the spatial data source.
- In case you want to visualize analytical data on the map, go to the Analytical data page of the dialog, select your dataset from the Dataset dropdown list and click the Add (+) button located next to the Match field. This makes the Spatial field and Analytical field options active. See, Add Data for more information.
- In the Spatial field and Analytical field options set data fields that contain similar data in both Spatial and Analytical databases. Match fields are used to relate the spatial data with the analytical data.
Note: It is necessary to set match fields if you want to use a data field from the analytical data to set spatial data for the layer, or if you want to visualize analytical data on the map.
- Go to the Filters page and set filters if any.
- Click OK to close the dialog and return to design surface.
- In the layers pane, right click on LineLayer1 and select Edit to open Map Line Layer dialog.
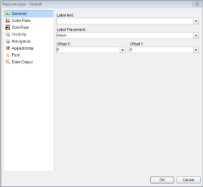
- In the General page of the dialog, select any data field from the Label Text dropdown list to display as label for each line that gets displayed on the map at run time. You can also set the label placement.
- Go to the Color Rule page to set rules to visualize data using color pallets, color ranges or custom colors for lines that gets displayed on the map or keep it set to "Use Appearance settings". See, Use Color Rule, Marker Rule and Size Rule for more information.
- Go to the Size Rule page to set rules to visualize data using line width or keep it set to the default line width.
- Go to the Visibility page of the dialog and make sure the layer visibility is set to Show. You can also select options to show or hide layer based on any expression or zoom value.
- In the Navigation page of the dialog, you can optionally link the layer to a URL, bookmark or a report.
- Go to the Appearance page of the dialog and set the style, width and color of the layer border and the layer background.
- In the Font page of the dialog, you can optionally set the font family, size, weight, style, set and color for the label text that you had set in the General page of the dialog.
- Go to the Data Output page and specify the Data Element Name of the layer to be used while rendering to XML and also specify whether the layer should be included in output while rendering or not.
- Click OK to close the dialog and go to the preview tab to view the map.
See Also