You can add subtotals and grand totals in a data region to add meaning to the data it displays.
Use the steps below to learn how to set subtotals and totals in each data region. These steps assume that you have already added a Page Report/RDL Report template and connected it to a data source. See Adding an ActiveReport to a Project, Connect to a Data Source and Add a Dataset for more information.
Note: This topic uses examples from the tables in the Reels database. By default, in ActiveReports, the Reels.mdb file is located at [User Documents folder]\GrapeCity Samples\ActiveReports 13\Data\Reels.mdb.
To add Totals and Subtotals in a Table
To add a subtotals to a table group
- From the Visual Studio toolbox, drag and drop a Table data region onto the design surface.
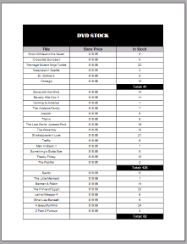
- From the Report Explorer, drag a numeric field (like InStock) onto the detail row of the Table. This is the field for which you want to display subtotals.
- Follow the steps below to add groups to the Table data region.
- Click inside the Table to reveal the row and column handles along the left and top edges.
- Right-click in the row handles along the left edge of the table and select Insert Group.
- In the Groups dialog that appears, set a Group on expression (like StorePrice) on which you want to group the data.
- Click the OK button to close the dialog and add the group. A new pair of rows for group header and footer appear on the Table.
- From the Report Explorer, drag and drop the numeric field (like InStock) you added to the detail row in step 2, onto the GroupFooter row.
- Double click the textbox containing the field you just dropped onto the GroupFooter row and add a Sum function to its expression to calculate the total [for example, =Sum(Fields!InStock.Value)].
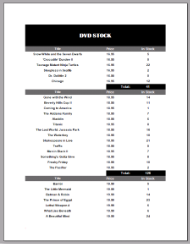
- Go to the Preview Tab to see the subtotals appearing below each group of data in the Table.
To add a grand total to a table
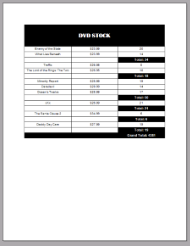
- Drag the numeric field (like InStock) you used to set subtotals on in the procedure above onto the Table Footer row.
- Double click the textbox containing the field you just dropped onto the Table Footer row and add a Sum function to its expression to calculate the total [for example, =Sum(Fields!InStock.Value)].
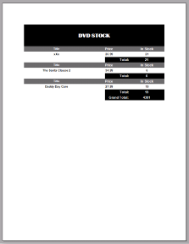
- Go to the Preview Tab and notice that at the end of the table, the Textbox from the Table Footer row supplies the grand total.
To add Totals and Subtotals in a List
To add a subtotals to a list
- From the Visual Studio toolbox, drag and drop a List data region onto the design surface.
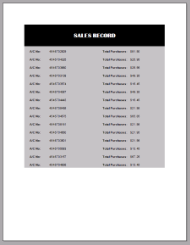
- From the Report Explorer, drag and drop a numeric field (like Price) onto the List data region.
- Double click the textbox containing the field you just dropped and add a Sum function to its expression to calculate the total [for example, =Sum([Price] * [Quantity])].
Note: If you preview the report at this point, you will notice that the field renders the grand total for the dataset after each sales amount.
- Follow the steps below to add detail grouping to the List data region.
- Right-click the list and select Properties.
- In the Detail Grouping page, select a Group on expression (like AccountNumber) on which you want to group the data.
- Click the OK button to close the dialog and apply grouping.
- Go to the Preview Tab to view the report, you can see a subtotal on price for each account number.
To add a grand total to a list
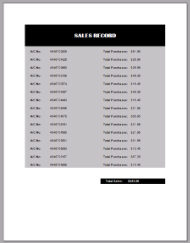
- Drag the numeric field that shows subtotals in your list (like Price) just below the List data region.
- Double click the textbox containing the field you just dropped and add a Sum function to its expression to calculate the grand total [for example, =Sum([Price] * [Quantity], "List1")].
- Go to the Preview Tab and notice that below the List there is a Textbox that supplies the grand total.
To add Totals and Subtotals in a BandedList
To add a subtotal to a banded list
- From the Visual Studio toolbox, drag and drop a Banded List data region onto the design surface.
- From the Report Explorer, drag a numeric field (Like InStock) onto the detail band of the banded list.
- Follow the steps below to add groups to the BandedList data region.
- Right-click the BandedList and select Insert Group.
- In the Groups dialog that appears, select a Group on expression (like StorePrice) on which you want to group the data.
- Click the OK button to close the dialog and add a group. A new pair of group bands appear on the data region.
- From the Report Explorer, the numeric field (like InStock) you added to the detail band in step 2, onto the GroupFooter band.
- Double click the textbox containing the field you just dropped and add a Sum function to its expression to calculate the subtotal[for example, =Sum(Fields!InStock.Value)].
- Go to the Preview Tab to view the report to see the subtotals appearing below each group of data in the BandedList.
To add a grand total to a banded list
- Drag the numeric field (like InStock) you used to set subtotals on in the procedure above onto the BandedListFooter band.
- Double click the textbox containing the field you just dropped onto the BandedListFooter band and add a Sum function to its expression to calculate the total [for example, =Sum(Fields!InStock.Value)].
- Go to Preview Tab and notice that at the end of the BandedList, the Textbox from the BandedListFooter band supplies the grand total.
To add Totals and Subtotals in a Tablix
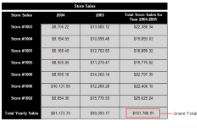
Note: In this example, we are using the StoreSalesbyYear table from the Reels database.
To add a subtotal to a Tablix group
- From the Visual Studio toolbox, drag and drop a Tablix data region onto the design surface.
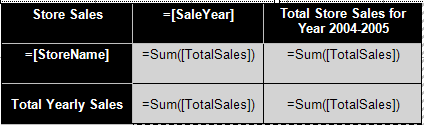
- Drag and drop the StoreName field from the Report Explorer to the row group area (bottom left corner) of the Tablix data region. This is the row header, and dragging a field into it automatically adds a row group.
- Drag and drop the SaleYear field from the Report Explorer to the column group area (top right corner) of the Tablix data region. This is the column header, and dragging a field into it automatically adds a column group. Modify the SaleDate field expression to =[SaleDate].Year to provide yearly data.
- Drag and drop the TotalSales field from the Report Explorer to the body area (bottom right corner) of the Tablix data region. This will automatically set expression of the cell to =Sum(Fields!TotalSales.Value).
- Right-click the column group area, select Add Total, and then click After. A new column appears to the right with the text Total. This displays the subtotals for each row group.
- Right-click the row group area, select Add Total, and then click After. A new row appears at the bottom with the text Total. This displays the subtotals for each column group.
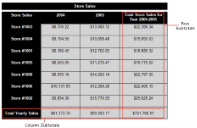
- Go to the Preview tab to view the subtotals for each year.
To add a grand total to a Tablix
- The row and columns subtotals set in the previous procedure, intersect at the rightmost cell of the Tablix that contains the grand total of the combined sales amount for years 2004 and 2005 in all the stores.
- Go to the Preview tab to view the result.
See Also