The Data Bar data visualization displays a 96 by 96 dpi bar image. The colored bar fills the Image top to bottom, while the Value argument determines the amount of colored bar to render to the right of the Zero argument (or to the left in the case of a negative value).
The Minimum and Maximum arguments determine the range of data. The area between the Value argument and the Maximum argument is transparent (or between the Value and the Minimum in the case of a negative value).
The Data Bar Data Visualizer is supported in the Image report control's Appearance - Value property, and also in the TextBox, CheckBox, Shape, and Container report controls' Background - Value property.
Parameters
- Value. This is the field value in the report to be evaluated. The data type is Single.
- Minimum. The lowest value in the range of data against which the Value argument is compared. This value corresponds to the leftmost edge of the image. If this argument is greater than the Zero argument, Zero becomes equal to Minimum. The data type is Single.
- Maximum. The highest value in the range of data against which the Value argument is compared. This value corresponds to the rightmost edge of the image. If this argument is less than the Zero argument, Zero becomes equal to Maximum. The data type is Single.
- Zero Value. This value determines the zero point to the left of which negative data is rendered, and to the right of which positive data is rendered. The data type is Single.
- Color. The HTML color string to use in rendering the Value in the bar image.
- Alternate Color. The HTML color string to use when the Value is less than the Zero value (optional).
Select the Use Alternate Color option to enable the Alternate Color parameter. You can use static values or aggregate functions (e.g. Min or Max) to set parameters.
Syntax
=DataBar(Value, Minimum, Maximum, Zero Value, Color)=DataBar(Value, Minimum, Maximum, Zero Value, Color, Alternate Color)
Usage
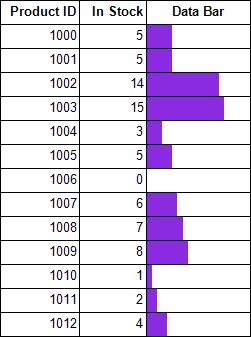
Use this data visualizer to render a bar in the color specified, the length of which changes depending on the number returned by the Value parameter, in the case of the simple example, InStock. If your data contains only positive values, Zero corresponds with Minimum at the left edge of the Data Bar. The area between the Value and the Maximum is transparent.
Simple Example
Set the Value parameter to the value of a field in your dataset to display the field values visually.
| Paste in the Background - Value property of the TextBox |
Copy Code
|
|---|---|
=DataBar(Fields!InStock.Value,0,20,0,"BlueViolet")
|
|
Example Using Negative Values
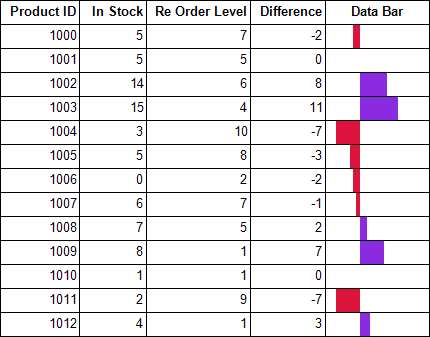
When your data contains negative as well as positive values, you can enable the Use Alternate Color option, and then select an Alternate Color. In this example, if the Difference value is negative, it is rendered in Crimson, while positive values are rendered in BlueViolet. You can also see that negative values are rendered to the left of Zero and positive values are rendered to the right.
| Paste in the Background - Value property of the TextBox control |
Copy Code
|
|---|---|
=DataBar(Fields!Difference.Value,-10,20,0,"BlueViolet","Crimson") |
|
Default Behavior
The function returns null (i.e. no image is rendered) in any of the following cases:
- The Maximum is less than or equal to the Minimum.
- The expression is placed in a property which does not take an image.
- The Source property of the image is not set to Database.
If the argument for any of the parameters cannot be converted to the required data type, the default value is used instead.
| Parameter | Default Value |
|---|---|
| Value | 0 |
| Minimum | 0 |
| Maximum | 0 |
| Zero | 0 |
| Color | Green |
| Alternate Color | null |
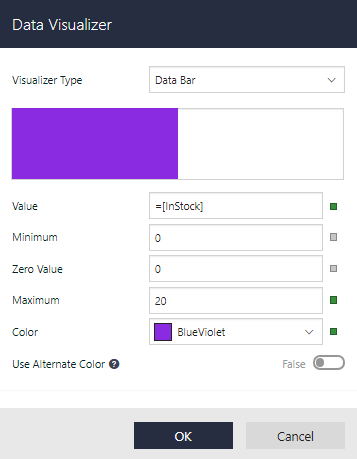
Dialog
For a TextBox, CheckBox, Shape, or a Container control on your report, in the Properties pane, go to Background - Value property, select radio button, and then select Data Visualizer... to launch the dialog. For an Image control, go to Appearance - Value property, select radio button, and then select Data Visualizer... . To build the data visualizer expression, select the appropriate values for each of the options in the dialog.
See Also